Body Numbers

Know your numbers, and what they cannot tell you

Your BMI, body fat, waist ratios, resting calories and daily energy, worked out free in the browser or on your phone. Every result names the formula behind it and says where that formula stops being useful.

  • Every calculator free
  • Nothing you type is sent anywhere
  • Plus is one purchase, never a subscription
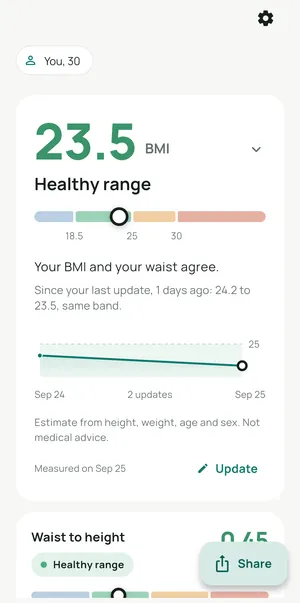
The app showing a BMI of 23.5 in the healthy range, the four coloured bands with a marker, a note that BMI and waist agree, and a chart of past readings
4.5 on Google Play100,000+ downloads16 free calculatorsEvery formula citedNo account, works offline

BMI was built to describe populations, not people

It compares your weight with your height and nothing else, so itcannot tell muscle from fat, and it cannot see where on your body the weight sits.

Muscle is denser than fat, and bone is denser still. So people of the same height can weigh exactly the same while being built quite differently, and the scale reports the same number for all of them.

Three people with the same BMI and three different bodiesThree grids of one hundred squares, each square one percent of an 85 kilogram body.Trains with weights: 15 percent fat, 47 percent muscle, 17 percent bone. Heavier skeleton: 18 percent fat, 37 percent muscle, 21 percent bone. Mostly desk work: 28 percent fat, 34 percent muscle, 14 percent bone. All three are 1.78 metres and 85 kilograms, so all three have a BMI of 26.8.Three people. All 1.78 m, all 85 kg.Every square is one percent of body weightBMI 26.8 for all threeTrains with weightsMore muscle than most47%muscle17%bone21%organs, skin, water15%fatHeavier skeletonBorn with more frame37%muscle21%bone24%organs, skin, water18%fatMostly desk workAverage build, more fat34%muscle14%bone24%organs, skin, water28%fatmuscleboneorgans, skin, waterfat
Illustrative, not measurements of real people. The tissue proportions come from Clarys, Martin and Drinkwater's cadaver dissection study (Human Biology, 1984), which found muscle at 50 percent of fat-free weight with a standard deviation of 4.4, and bone at 20.6 percent with a standard deviation of 2.6. Each of these three sits at a different point inside that normal spread.

So why would two people differ?

  • Muscle. Someone who trains, or whose job is physical, simply carries more of it. This is the reason people usually think of, and it is the most common one.
  • Frame. Skeletons genuinely differ in weight, and you are born with yours. In the cadaver study the diagram draws on, bone ran from roughly 15 to 26 percent of fat-free weight between individuals. A heavier frame is weight on the scale that is not fat and never will be.
  • Ancestry. At the same BMI, average body fat differs between populations. It is why the World Health Organization advises lower BMI cut points, 23 and 27.5, for people of South and East Asian descent.
  • Age and sex. Both change the share of your weight that is fat, at any given BMI, which is why healthy body fat ranges are published per sex and per age band.

BMI sees none of this. It sees a height and a weight, which is why the app runs several methods next to each other instead.

Why you get more than one body fat number

There is no single agreed formula for estimating body fat from a tape measure. There are several, they were built from different measurements on different groups of people, and they disagree. Here is the same man run through all three.

The same man each time: 1.70 m, 70 kg, 80 cm waist, 38 cm neck, age 30. That is a BMI of 24.2, inside the healthy band.

US Navy circumference

13.7%

Healthy range

What it needs
Height, neck and waist. Women add a hip measurement.
What it is good at
Uses more than one circumference, so it can tell a thick neck from a wide waist. With a tape measure to hand it is the most informed of the three.
Where it falls down
The equation was fitted on US Navy personnel, so it assumes a build and a fat distribution close to theirs. Here it returns the lowest of the three figures.

Hodgdon and Beckett, Naval Health Research Center, 1984

Relative Fat Mass

21.5%

Above healthy range

What it needs
Height and waist. Nothing else.
What it is good at
Published in 2018 and checked against DEXA scans in a large US national survey, where it estimated whole body fat with less error than BMI did.
Where it falls down
One circumference is all it knows. It cannot see anything about you above the waist, muscle included.

Woolcott and Bergman, Scientific Reports, 2018

Deurenberg, from BMI

19.8%

Healthy range

What it needs
No tape measure at all. Height, weight, age and sex.
What it is good at
The fallback that always works. If all you have is a set of scales and a door frame, this still gives you an estimate.
Where it falls down
BMI is its only body input, so it inherits every blind spot BMI has. Muscle and fat count the same to it.

Deurenberg, Weststrate and Seidell, British Journal of Nutrition, 1991

7.8 percentage points separate the highest and the lowest, for one man, on one day, from one set of measurements. Two of the three call him healthy. The third puts him above the healthy range.

None of them is lying. They are different estimates built for different inputs, and the healthy bands they are read against come from Gallagher and colleagues, 2000, which sets a healthy range of 8 to 20 percent for a man of this age.

What to do with that: pick the method your measurements support, measure the same way each time, and watch your own direction of travel. A body fat percentage with no method attached to it is not information, and comparing your number against somebody else's from a different formula tells you nothing.

All three are estimates from a tape measure, not body composition scans, and none of them diagnoses anything. If a result concerns you, take it to a doctor rather than to a calculator.


A number you cannot trace is just a number

These are the published formulas the app uses. It names each one on screen and cites the paper it came from.

  • Body mass indexWeight against height squared, read against the WHO cut points. Lower cut points are available for people of South and East Asian descent, where health services advise them.World Health Organization
  • BMI for age, for children and teenagersA percentile for their exact age in months and their sex, because a healthy BMI changes as a child grows. Adult cut points do not apply.WHO growth reference, 2007
  • Relative Fat MassHeight divided by waist. It tracks body fat more closely than BMI does, and it needs only a tape measure.Woolcott and Bergman, Scientific Reports, 2018
  • Waist to height ratio, and Body Roundness IndexWhere the weight sits rather than how much of it there is. Both are read from a waist measurement and your height.Body Roundness Index: Thomas and colleagues, 2013
  • Resting metabolic rate and daily energyThe calories your body uses at rest, multiplied by how active you are, plus a macro split you can adjust.Mifflin St Jeor equation

What it looks like

All of this is free. Plus removes the ads and adds cloud sync, and that is the whole of it.

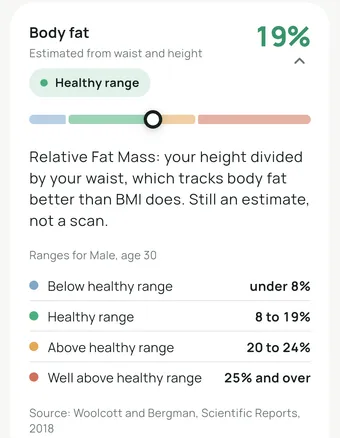
The body fat card: 19 percent by Relative Fat Mass, the four ranges for a 30 year old man, and the source cited as Woolcott and Bergman 2018

Every method explains itself

Tap any result and it tells you which formula produced it, which measurements went in, what the healthy range is for your sex and age, and the paper the cut points come from. No result is presented as a bare number you have to take on trust.

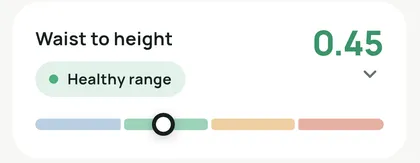
The waist to height card reading 0.45, marked as healthy range on the four coloured bands

Where the weight sits

Waist to height ratio is the one extra measurement worth taking. Keep your waist under half your height and you are inside the guide. In a meta-analysis it screened for cardiometabolic risk better than BMI did, and it costs you a tape measure and ten seconds.

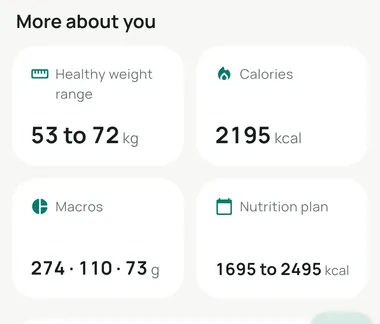
Four tiles showing a healthy weight range of 53 to 72 kg, 2195 calories, macros of 274, 110 and 73 grams, and a nutrition plan of 1695 to 2495 calories

It reuses what you already typed

Once it knows your height, weight, age and activity level, it works out your healthy weight range, what you burn at rest, what you burn in a day, and a macro split. All of it from the measurements you have already entered, none of it asking for anything else.

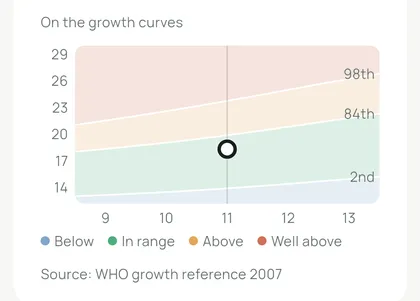
A child's BMI for age plotted on the WHO 2007 growth curves between the 2nd, 84th and 98th percentile lines

A child's healthy BMI moves every month

A healthy BMI for a child changes month by month as they grow, so adult cut points do not apply and the app refuses to use them. Ages 5 to 19 are placed on the WHO 2007 growth curves for their exact age and sex, which is how a clinic would read it.

Three apps, three different jobs

This one answers the question today. If you want to watch a number move over weeks, one of the other two is a better fit.

You are here

BMI Calculator: TDEE, Body Fat

The number now, and the method behind it.

Get it free on Google Play

Weight Diary

Your weight day by day, and the trend under the noise.

Get Weight Diary on Google Play

Body Diary

Measurements over time, with the photos and charts beside them.

Get Body Diary on Google Play

Compare all three, feature by feature

What people say

Real reviews from Google Play, quoted exactly as written. Each one links to itself on the listing so you can check it.

Very easy to navigate and use. The accuracy is far superior to any other BMR/TDEE calculators I've seen. Great job to the developers!
Saiyan Youthon Google Play
I'm a dietitian and this app is very helpful in making diet plansā¤ it gives so accurate calculations.
Mehak Fatimaon Google Play
Other than BMI, it gives your ideal weight, your nutrition plan, and your calorie intake
Abhimanyu Dhimanon Google Play
We can calculate our exact total daily energy expenditure and make custom nutrition plans.and make a perfect diet plan.great app
Mohit patelon Google Play
What a cool body calculator. It is very simple in use and works perfectly well. Recommend.
Kari Strayon Google Play
Excellent BMI app with so many other informative tools
Sahith Pon Google Play

See when two methods disagree about you

Free on Google Play. The app runs every method your measurements allow side by side, names the formula behind each one, and says so when they do not agree.

Free, no account, and it works offline. 100,000+ downloads on Google Play.

This is not medical advice. Body Numbers is a calculator. It does not diagnose, treat or monitor any condition, and no number it produces should replace a conversation with a doctor or a dietitian. If a result worries you, or if you are pregnant, unwell, or under eighteen, speak to a health professional.

Scan to install